Tweaking of a model is just part of the process; without correct evaluation, there’s no way to know for sure whether the model has been improved during training and hasn’t developed any flaws due to this process. The model may be working quite nicely in several manually conducted tests, but fails to work in certain edge cases, displays some biases, or just remembers the training examples instead of learning something. It is very important to know which metrics to use and what they mean exactly, because otherwise you will not be able to tell if your model performs well or not. The following article discusses the metrics, the approaches to the process of evaluation, and the mistakes to avoid in the process.
Table of Contents
Why Evaluation Matters After Fine-Tuning?
Not evaluating fine-tuned models properly is one of the most frequent and expensive errors in the process of using custom models. In the absence of evaluation metrics, it is very tempting to think that a model that showed good results on several examples is reliable in all cases. The proper evaluation process will allow identifying regressions, i.e., instances where the fine-tuning process helped to improve the performance on a certain task but led to degradation in other aspects. The right evaluation is the thing that turns a mere experiment into a proven step forward. A few improvements that can be noticed after evaluation are:
- Proves Improvements: Evaluation proves that fine-tuning really improved performance and not just changed behavior.
- Discovers Regressions: Comprehensive testing helps to identify cases of regression, i.e., when the performance was worse in some aspects.
- Gives Grounds for Deployment: Proper metrics allow providing evidence of the fact that the model is ready to be deployed.
- Helps to Decide on Future Steps: The evaluation results show where the work should be continued.
- Saves Money: The errors can be discovered more easily during the evaluation process.
Quantitative Metrics
Quantitative metrics offer evaluators a reliable, repeatable method to assess how the performance of a machine learning model compares to a benchmark or dataset. The metrics are especially handy when working with classification-type tasks, as the answers can easily be assessed for correctness. Though figures do not cover everything regarding the quality of the model, they offer a consistent base that allows you to compare various versions of the same model. The selection of the appropriate metrics greatly depends on the particular task the model is trained for. Given below are some common metrics along with their mathematical formulas and examples.
1. Accuracy: Percentage of correctly classified examples from all classifications done.Formula:
Example:Accuracy = Correct Predictions ÷ Total Predictions
Classification of 90 correct out of 100 support tickets results in 90% accuracy.
2. Precision: Percentage of the correctly predicted positive answers from all positive predictions. Important in case when false positive predictions carry a high cost.
Formula:
Example:Precision = True Positives ÷ (True Positives + False Positives)
Predicting 20 emails to be spam messages, while there are actually only 16 spam emails, yields a precision of 80%.
3. F1 Score: Calculates both precision and recall into one value that’s used when both false positives and false negatives need to be accounted for. Calculation
Formula:
Example:F1 = 2 x (Precision x Recall) / (Precision + Recall)
If the values for precision and recall are 80% each, then the resulting F1 score will also be 80%.
4. Confusion Matrix Analysis: Identifies exactly where the classifier is making mistakes.
Example:
A confusion matrix can indicate that the classifier often confuses “neutral” reviews for “positive” ones.
Language Generation Metrics: BLEU, ROUGE, and Perplexity
Metrics for generating free-form text that is not selected among fixed categories differ substantially, and they mostly measure similarities between generated text and references. Such scores are helpful, but not always reflective of meanings or usefulness; therefore, they are often used along with human evaluation. Yet they offer an efficient tool to monitor the progress of the learning process through multiple training episodes. Kindly refer to the bibliography section for a non-abbreviated form of the terms mentioned below.
1. BLEU Score: A measure of how close the generated text is to the reference text in terms of word sequence overlaps; used mainly for machine translation.Equation:
Example: A translation that shares most word sequences with the reference gets 1, and vice versa.BLEU = Brevity Penalty × exp(average of log n-gram precisions).
2. ROUGE Score: Measures recall-based overlap of text, usually utilized for estimating summarization quality compared to reference summaries.
Equation:
Example: If a generated summary contains 8 out of 10 key words of the reference summary, ROUGE-1 recall is 80%.ROUGE-N = Overlapping n-grams ÷ Total n-grams in the reference.
3. Perplexity: The concept refers to how good a prediction is made by a model in predicting the next word in the sequence. The lower the perplexity, the better the language model performance will be.
Formula:
Example:Perplexity = 2^(cross-entropy loss).
If the perplexity is 20, then this means that, on average, the prediction does not know more than choosing one out of the 20 equally probable next words.
4. BERT Score: This concept uses an embedding representation of texts to compare meaning between the generated text and the reference text. Thus, BERTScore compares texts semantically, which is more than just comparing the words, unlike BLEU.
Formula:
Example: Two sentences can have different wording but the same meaning while scoring high.BERTScore = the cosine similarity of the embeddings of the generated text and the reference text.
5. Diversity Metrics: This concept aims at identifying whether the produced text is unique and of natural quality.
Formula:
Distinct-n = Number of unique n-grams/Total number of n-grams.
Example: In case a chatbot repeats the phrase "I don't know" too many times, it will presumably have a low distinct-2 score.
Human Evaluation
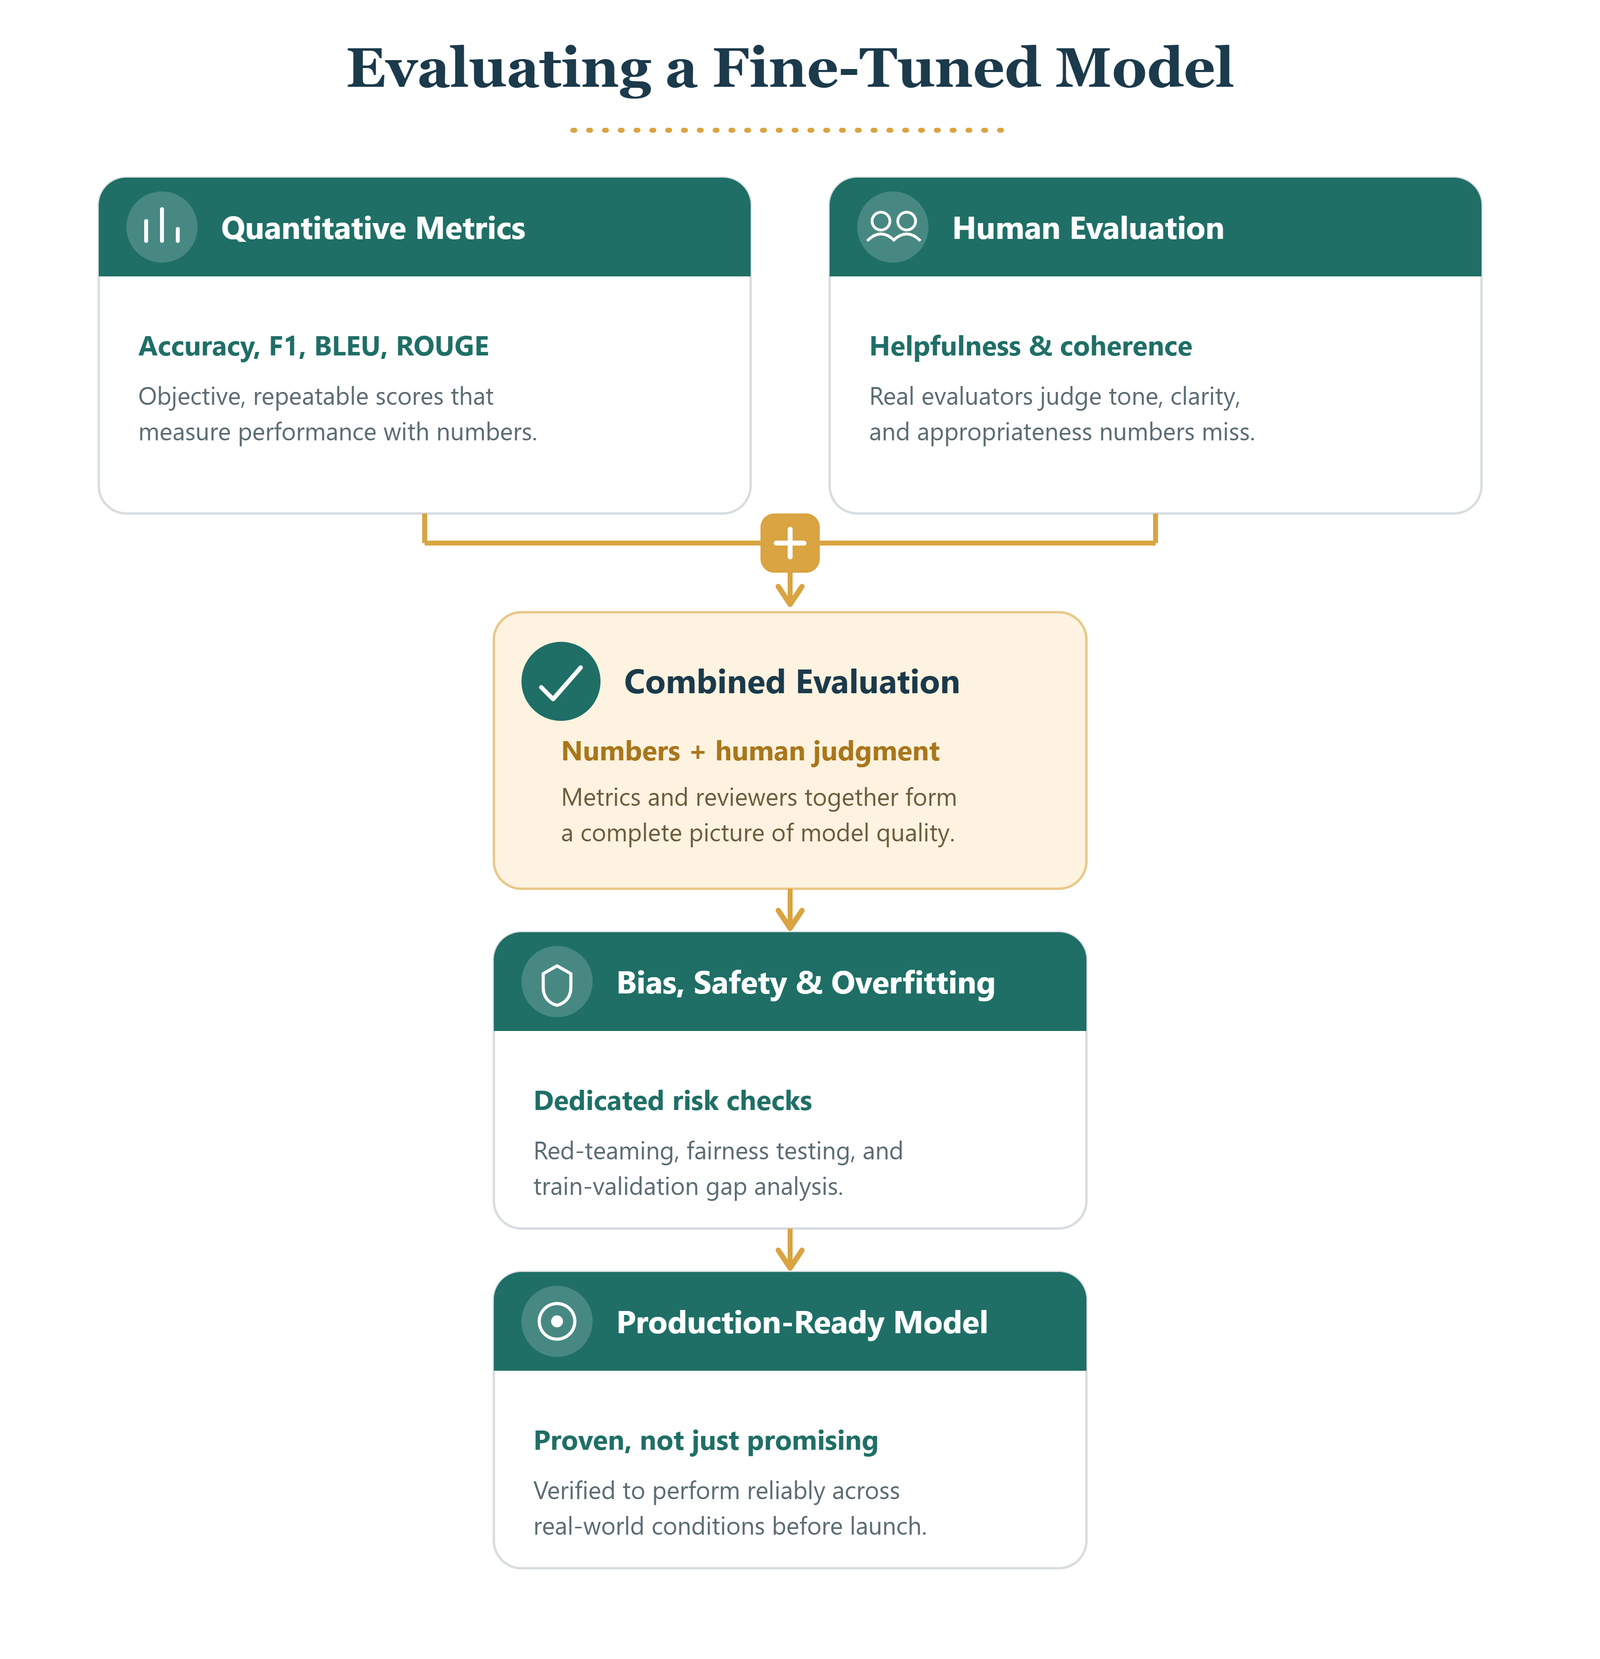
Automated metrics are efficient and scalable; however, they do not account for important human aspects such as tone, helpfulness, coherence, and appropriateness. Human evaluation makes up for this shortcoming as it uses actual people who will assess the output of models according to criteria that cannot be automatically measured. Human evaluation is crucial when it comes to conversational AI, as a technically correct answer may appear to be unhelpful, robotic, or even inappropriate. Even though this type of assessment is costly and takes more time than automatic evaluation, human evaluation should not be skipped.
- Helpfulness Ratings: Evaluators assess whether an answer really addresses the needs of a user.
- Coherence and Fluency Assessment: Human evaluators evaluate whether answers sound natural and coherent.
- Preference Comparisons: Evaluators compare the outputs of models with different versions of the same model to see which one is better.
- Tone and Appropriateness Assessment: Human evaluators identify potential problems with the tone and sensitivity that automated metrics would miss.
- Qualitative Feedback Collection: Comments of human evaluators often indicate some issues that were not revealed with quantitative metrics.
Task-Specific Benchmarks
In addition to general evaluation metrics, there are several other types of evaluation benchmarks that may be useful when fine-tuning an AI system. Task-specific benchmarks help measure the effectiveness of a model on a particular task since they allow comparing the performance of the model to the baselines and competing solutions. In addition, using task-specific benchmarks guarantees that the evaluation process is as close to reality as possible.
A few important points to be noted are:
- Task-Specific Test Set: Curated data set containing examples of the exact questions/tasks the model is supposed to solve in real life.
- Industry Standard Benchmark: A well-known evaluation framework, specific to the task (for example, question-answering or summarization benchmark).
- Specific Edge Case Testing: Hand-picked examples that help to evaluate the performance on specific cases.
- Baseline Comparison: Evaluation of the fine-tuned model relative to the original base model.
- Real User Scenario Testing: Testing against random queries the model is likely to receive after implementation.
Evaluating for Bias, Safety, and Toxicity
Even models with high accuracy in performance may turn out to produce biased, inappropriate, or even dangerous content. This is why the special process of evaluating their safety is crucial and should be conducted as an independent stage. Safety evaluation tests look for the ability of models to behave prejudiced toward some social groups, generate toxic content, or properly process sensitive topics. Some common tests are as follows:
- Bias Detection Test: Testing for the model’s behavior with regard to the quality or tone of the response to different social groups.
- Toxicity Screening: Automatic classifiers analyze outputs to find offensive or inappropriate language.
- Red-Teaming: The evaluators try to provoke the model to generate unsafe or unacceptable responses.
- Appropriateness Eefusal Check: Checking how appropriate the model is to refuse the toxic inputs.
- Sensitive Topic Handling: Analyzing the way the model processes sensitive topics.
Common Evaluation Metrics at a Glance
With so many available metrics, it helps to see them side by side to understand what each one actually measures and when it's most useful. The table below summarizes the most common evaluation metrics used when assessing a fine-tuned model.
| Metric | What It Measures | Formula | Best Used For |
|---|---|---|---|
| Accuracy | Percentage of correct predictions overall | (TP + TN) ÷ (TP + TN + FP + FN) | Classification tasks with clear right/wrong answers |
| Precision | Correctness of positive predictions | TP ÷ (TP + FP) | Tasks where false positives are costly |
| Recall | Coverage of actual positive cases | TP ÷ (TP + FN) | Tasks where missing cases are costly |
| F1 Score | Balance between precision and recall | 2 × (P × R) ÷ (P + R) | Tasks needing both metrics are weighed together |
| BLEU | Word-overlap similarity to reference text | BP × exp(avg. log n-gram precision | Translation and text generation tasks |
| ROUGE | Recall-based overlap with reference text | Overlapping n-grams ÷ Reference n-grams | Summarization tasks |
| Perplexity | How well the model predicts the next words | 2^(cross-entropy loss) | General language modeling quality |
| Human preference score | Real evaluator judgment of quality | % of comparisons rated as preferred | Conversational and open-ended response tasks |
Checking For Overfitting and Generalization
One of the biggest challenges in fine-tuning is avoiding overfitting, a situation where the model memorizes the training data instead of learning patterns it can apply to new inputs. An overfitted model may achieve excellent training results but struggle when faced with real-world data it has never seen before. To spot this early, it's important to evaluate the model on separate validation and test datasets and compare the results. If performance is significantly better on the training data than on unseen data, it's a clear sign that the model isn't generalizing well. Detecting overfitting before deployment helps ensure the model performs reliably in production rather than just in controlled testing.
- Train-Validation-Test Splits: Keep the training, validation, and test datasets completely separate so you can accurately measure how well the model performs on unseen data.
- Performance Gap Analysis: Compare metrics across the training and validation sets. A large gap usually indicates the model is memorizing examples instead of learning general patterns.
- Cross-Validation: Evaluate the model across multiple train-validation splits to ensure the results are consistent and not influenced by a single favourable dataset split.
- Out-of-Distribution Testing: Test the model on data that differs from the training distribution to see how well it handles unfamiliar scenarios and real-world variation.
- Monitoring Across Training Epochs: Track validation performance throughout training. When validation metrics stop improving or begin to decline while training performance continues to increase, it's often the first sign that overfitting has started.
Common Evaluation Errors To Avoid
Even teams with a lot of experience can make mistakes when they evaluate a model that has been fine-tuned. These mistakes can lead to conclusions about how well the model really works. It is helpful to know about these mistakes so that the evaluation process actually shows how the model will perform in the real world. Avoiding these mistakes is just as important as picking the things to measure in the first place. Some common errors include:
- Testing on Data Similar to Training Data: If you only test the model with examples that are almost the same as the training data, the scores will be higher than they should be. This does not really show that the model can work well with different data.
- Relying Much on One Metric: No single score can tell you everything about the model. If you only look at one score, you might not see the problems.
- Not Paying Attention to Human Feedback: If you only look at numbers, you might miss problems that people would notice.
- Not Checking for Safety and Bias: A model can get a score on some tasks but still be very poor at being fair or safe.
- Not Evaluating the Model Enough: If you wait until the end to see how the model is doing, it will be harder to find and fix problems when you are still working on the model.
Best Practices For Evaluating a Fine-Tuned Model
To develop an effective evaluation process, several metrics and methods need to be employed. Evaluation must take into account the objectives and dangers involved in performing a certain task using the fine-tuned model. Below is a list of common practices that should be considered while developing an evaluation process.
- Use Both Quantitative and Qualitative Metrics: Apply numerical metrics together with human assessment for a thorough evaluation of the model.
- Compare the Results with the Base Model: Evaluate the fine-tuned model relative to its base version.
- Use of a Varied Set of Examples: Ensure that the testing sets include all possible cases where the model may be used.
- Conduct Safety Testing Along with Performance Evaluation: Bias and safety testing must be regarded as an inherent part of the process.
- Do Reevaluation on a Regular Basis After Deployment: It is important to conduct regular evaluations after deploying the model in practice.
Abbreviations Used in This Article
Evaluation metrics come with a lot of short forms, and it's easy to lose track of what each abbreviation actually stands for. The table below lists every abbreviation used throughout this article as a quick reference.
| Abbreviation | Full Form | What It Means |
|---|---|---|
| TP | True Positive | A case that the model correctly predicted as positive |
| TN | True Negative | A case that the model correctly predicted as negative |
| FP | False Positive | A case that the model incorrectly predicted as positive |
| FN | False Negative | A case that the model incorrectly predicted as negative |
| F1 | F1 Score | The harmonic mean of precision and recall |
| BLEU | Bilingual Evaluation Understudy | A metric measuring word-overlap similarity to the reference text |
| ROUGE | Recall-Oriented Understudy for Gisting Evaluation | A recall-based metric comparing generated text to reference summaries |
| BP | Brevity Penalty | A correction factor in BLEU that penalizes overly short outputs |
| BERT | Bidirectional Encoder Representations from Transformers | The embedding model underlying BERTScore's semantic comparisons |
| N-gram | N-gram (not an acronym) | A contiguous sequence of "N" words used in BLEU, ROUGE, and diversity metrics |
Conclusion
Fine-tuned model evaluation is no less important than the process of fine-tuning itself, as the quality of training data and an appropriate pipeline is useless if no reliable metric can estimate the model performance. In addition, the evaluation of the model using various scoring mechanisms allows for estimating its quality more accurately than a single metric. In particular, a complete assessment involves not only standard accuracy and F1-score but also linguistic evaluations, such as BLEU and perplexity, and human judgments, which provide the most objective estimation of model performance. Moreover, a reliable evaluation strategy can include measures that estimate overfitting, bias, and safety, thus ensuring the model’s reliability. Therefore, any competent model fine-tuning is impossible without a careful assessment of these quality parameters, as it allows to reveal potential issues that were not considered during training.
Frequently Asked Questions
1. Which metric is most important when evaluating a fine-tuned model?
There isn't a single best metric, the right choice depends on the task, and most reliable evaluations combine several metrics alongside human judgment.
2. Is human evaluation always necessary?
For tasks involving open-ended or conversational output, yes. Automated metrics alone often miss nuances like tone, helpfulness, and appropriateness that matter to real users.
3. How can I tell if my fine-tuned model is overfitting?
A large gap between performance on training data and performance on separate validation or test data is a strong sign of overfitting.
4. Should I always compare against the original base model?
Yes. Comparing against the base model is the clearest way to confirm that fine-tuning actually produced a meaningful improvement.
5. How often should I re-evaluate a model after it's deployed?
Regularly. Real-world usage patterns can shift over time, so periodic re-evaluation helps catch performance drift or emerging issues early.

0 Comments